Fantasy Analysis
RB ADP Breakout Signals
Which backfields with no top-24 running back by draft cost still have enough team, market, and opportunity signal to produce a top-24 PPR finisher?
The short version: the edge is real, but it is not “draft every ambiguous backfield.” The useful signal comes from stacking market shape with team environment and prior running back opportunity.
The Thesis
- The edge is real but conditional. Across 2010-2025, teams without a top-24 RB by preseason ADP produced a top-24 PPR finisher in 83 of 146 eligible team-seasons.
- Signal stacking is the actual edge. Rooms with four or five core signals hit 25 of 37 times, while simple ADP ambiguity barely beat the baseline.
- Seattle and Pittsburgh are the current priority rooms. Seattle carries all five signals. Pittsburgh carries four. Both also have meaningful backfield opportunity turnover.
- The rest need price discipline. Cleveland and Houston are useful secondary cases. Carolina is downgraded. Tennessee, Minnesota, and Washington are monitors.
The Decision Frame
The cohort uses 12-team PPR preseason ADP from 2010-2025, regular-season RB finishes, and only team-seasons where the team’s best preseason RB cost was worse than RB24. A hit is any team-season that produced at least one top-24 PPR running back.
The five signals:
- First team RB priced RB25-RB48.
- Two team RBs inside the top 60 by ADP.
- Prior offense ranked top 16 in points per game.
- Prior RB room ranked top 12 in carries plus targets.
- Current-season implied-points profile ranked top 12.
Signal Stacking Is The Usable Edge
Four- and five-signal rooms hit at 67.6%, a meaningful lift over the 56.8% baseline. Three-signal rooms are playable only when the price or depth-chart news cooperates.
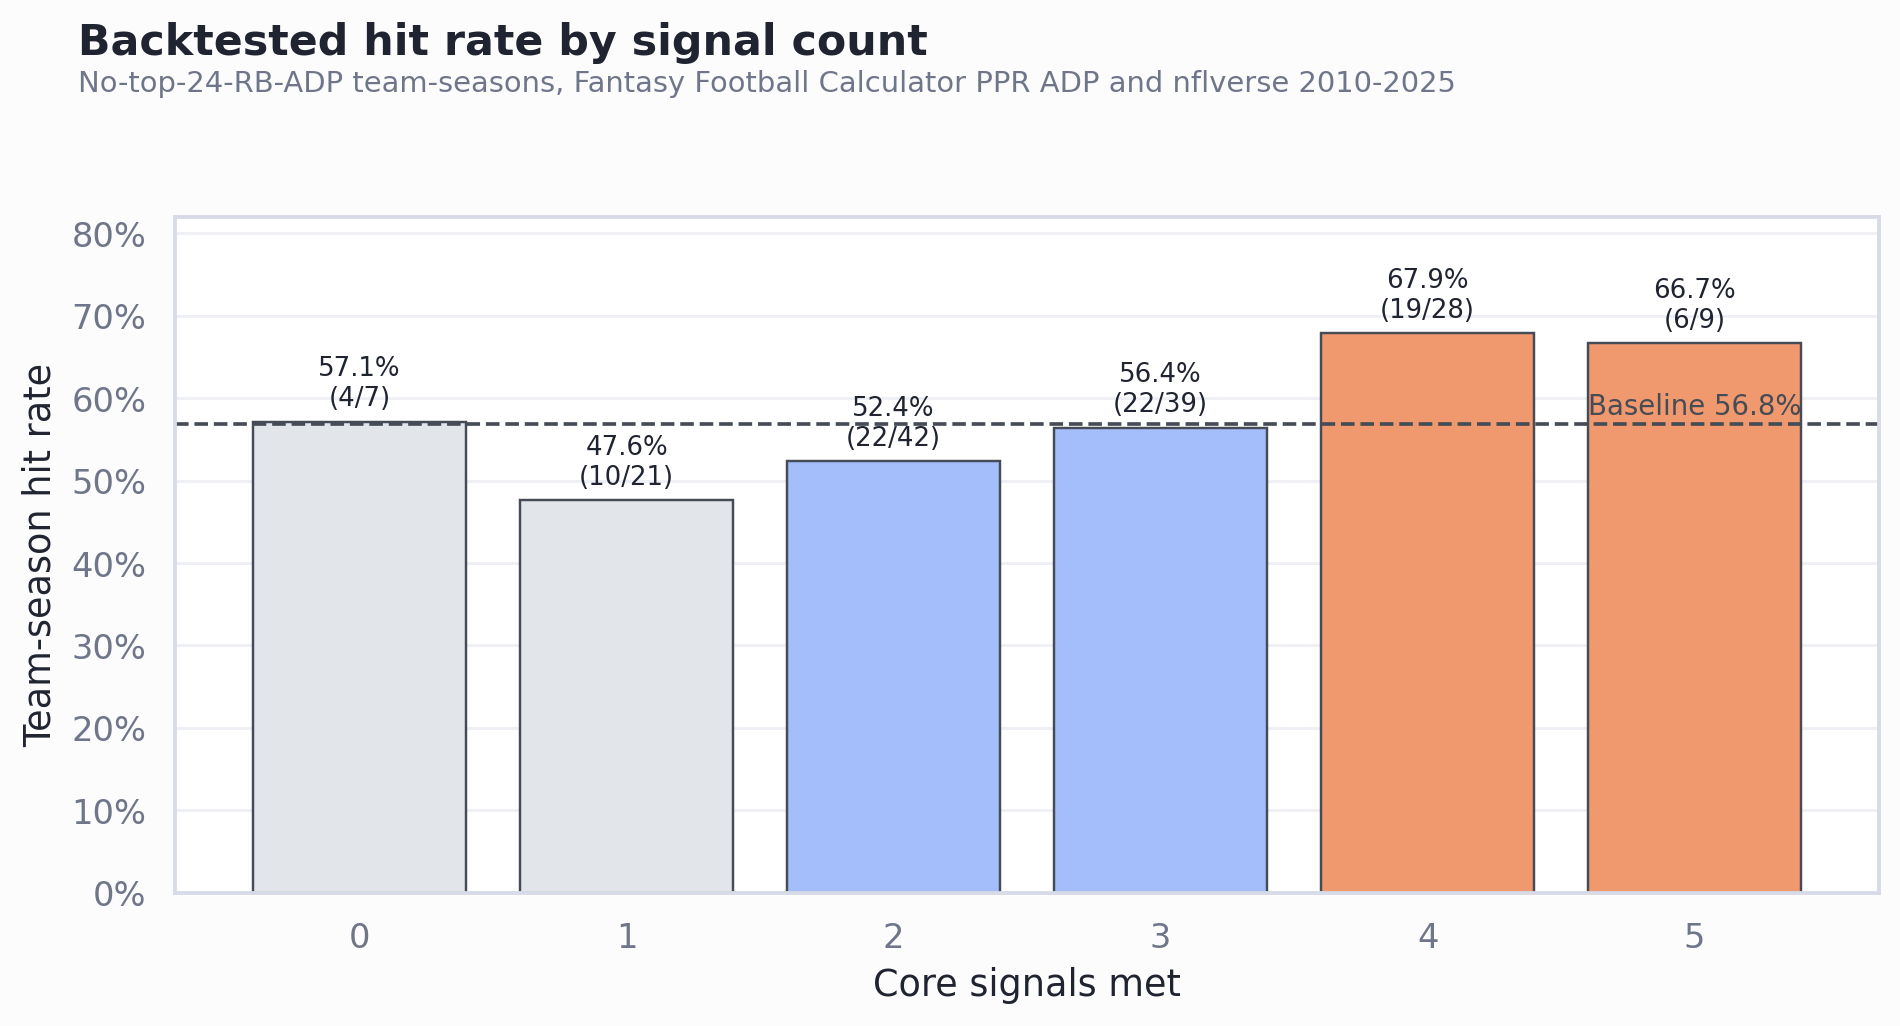
| Signals | Team-seasons | Hits | Hit rate | Avg best RB ADP rank |
|---|---|---|---|---|
| 5 | 9 | 6 | 66.7% | 29.3 |
| 4 | 28 | 19 | 67.9% | 29.1 |
| 3 | 39 | 22 | 56.4% | 81.7 |
| 2 | 42 | 22 | 52.4% | 101.5 |
| 1 | 21 | 10 | 47.6% | 265.5 |
| 0 | 7 | 4 | 57.1% | 864.3 |
Environment Carries The Model
The best clues are team-environment checks: prior RB opportunity, prior offense quality, prior RB production, and implied-points context. Ambiguity by itself is not enough. Two top-60 RBs hit at 57.3%, which is basically the baseline.
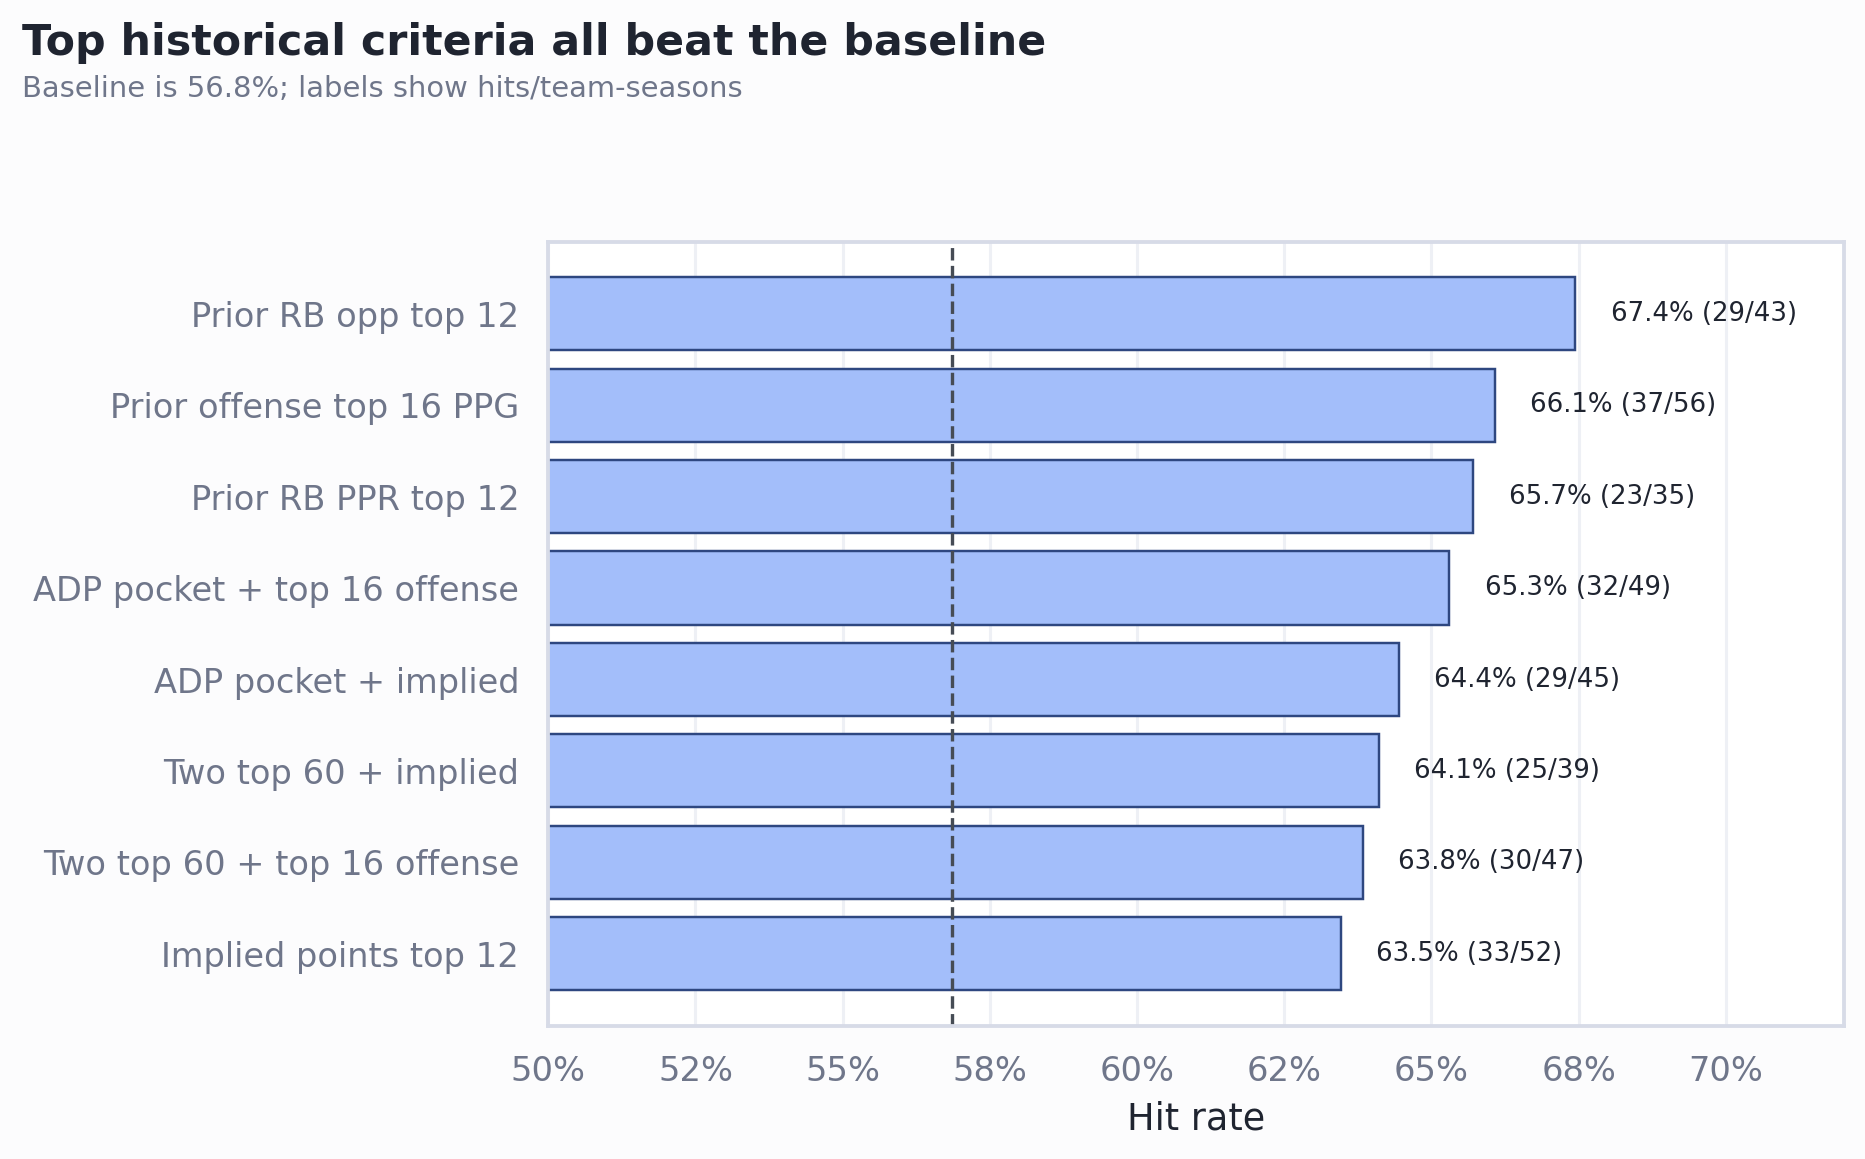
| Criterion | Team-seasons | Hits | Hit rate | Lift |
|---|---|---|---|---|
| Prior RB opportunity top 12 | 43 | 29 | 67.4% | 1.19x |
| Prior offense top 16 PPG | 56 | 37 | 66.1% | 1.16x |
| Prior RB PPR top 12 | 35 | 23 | 65.7% | 1.16x |
| ADP pocket plus top-16 offense | 49 | 32 | 65.3% | 1.15x |
| Implied points top 12 | 52 | 33 | 63.5% | 1.12x |
2026 Board
Seattle and Pittsburgh are the only rooms with enough signal to draft aggressively before camp confirmation. Cleveland, Houston, and Carolina have three signals and need tighter price or role validation. Tennessee, Minnesota, and Washington are watch-list rooms.
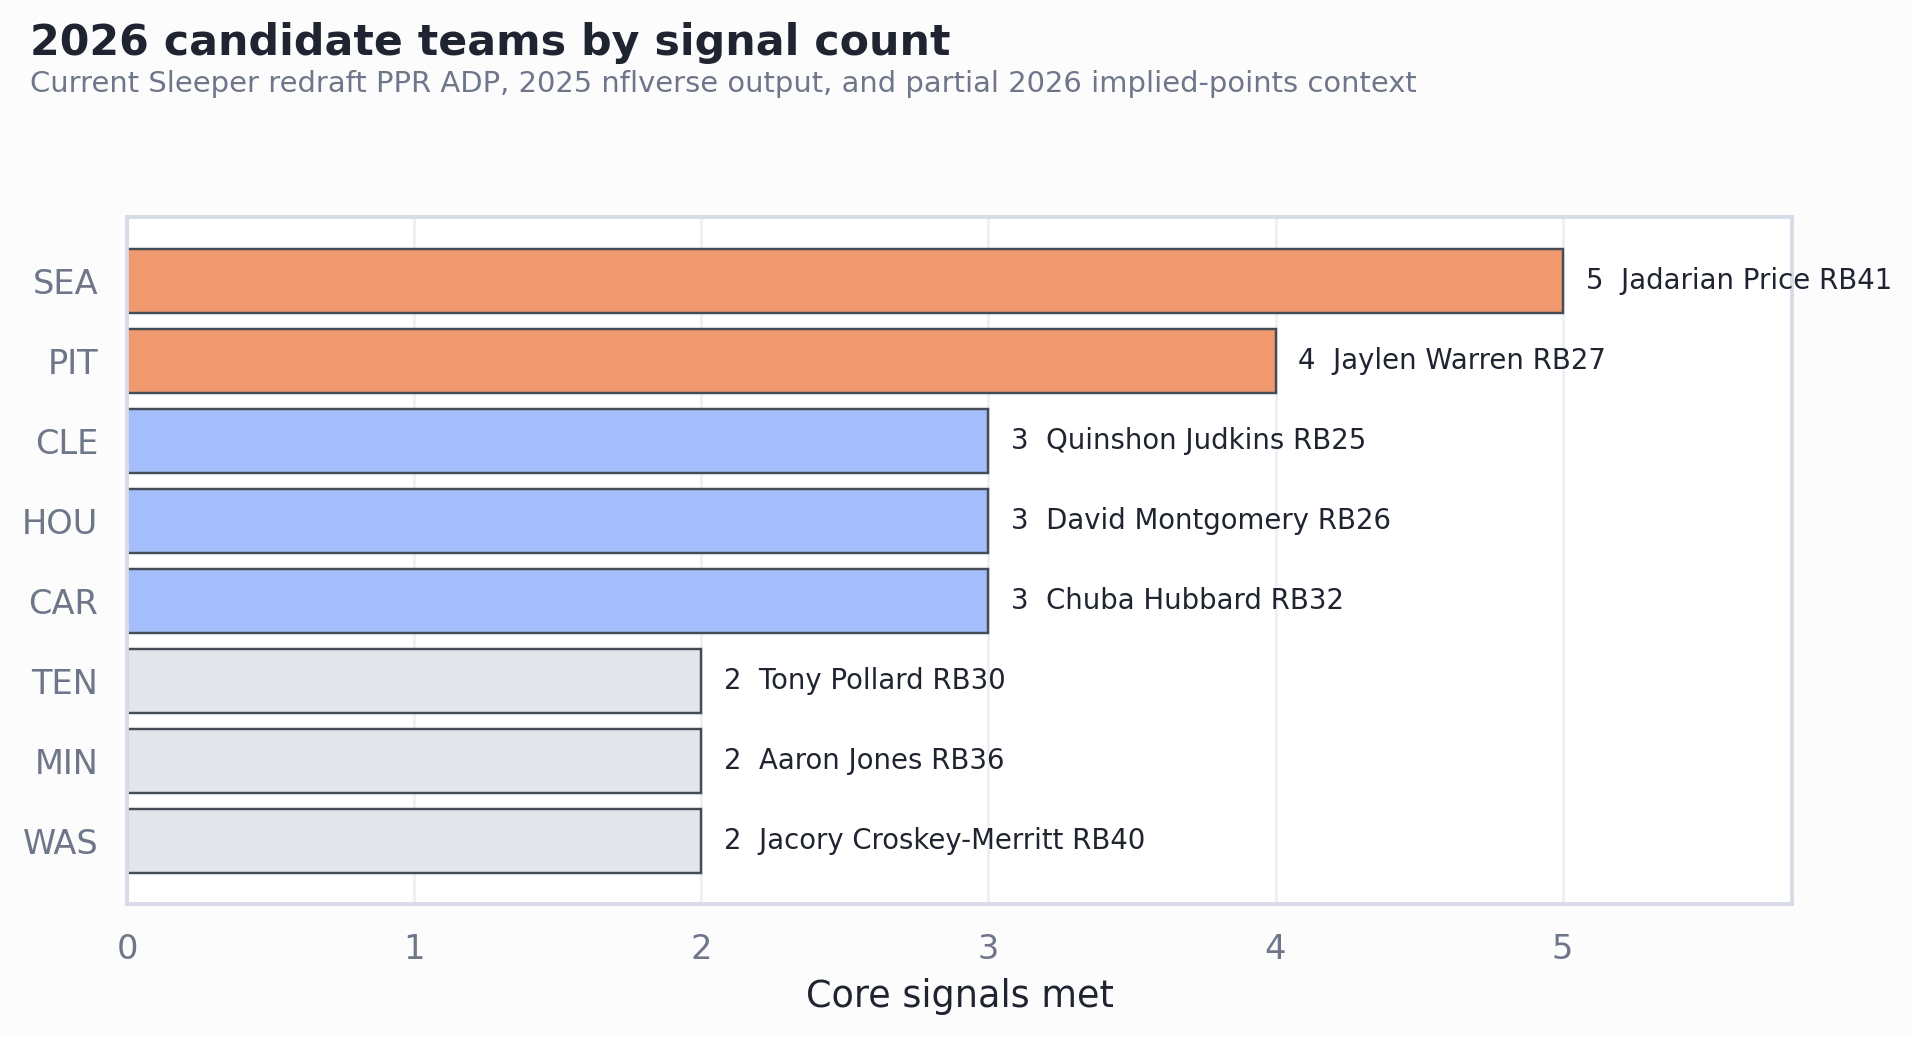
| Team | Tier | Signals | Lead RB cost | Second RB cost | Prior PPG rank | Prior RB opp rank |
|---|---|---|---|---|---|---|
| SEA | Priority | 5 | Jadarian Price RB41 | Zach Charbonnet RB42 | 3 | 4 |
| PIT | Priority | 4 | Jaylen Warren RB27 | Rico Dowdle RB31 | 15 | 8 |
| CLE | Secondary | 3 | Quinshon Judkins RB25 | Dylan Sampson RB52 | 31 | 12 |
| HOU | Secondary | 3 | David Montgomery RB26 | Woody Marks RB43 | 13 | 15 |
| CAR | Downgrade | 3 | Chuba Hubbard RB32 | Jonathon Brooks RB57 | 27 | 9 |
| TEN | Monitor | 2 | Tony Pollard RB30 | Tyjae Spears RB50 | 30 | 27 |
| MIN | Monitor | 2 | Aaron Jones RB36 | Jordan Mason RB45 | 26 | 28 |
| WAS | Monitor | 2 | Jacory Croskey-Merritt RB40 | Rachaad White RB51 | 22 | 31 |
Situation check: Seattle and Pittsburgh each return roughly half of last year’s backfield production, opening a believable volume path. Carolina returns even less, but that is a downgrade because the missing production belonged to the same back who drove the prior-opportunity signal.
Player Cases And Action Thresholds
Target the room, but draft the player whose path matches the historical cost bucket. The first drafted RB is safest in the RB25-RB36 pocket; the second drafted RB matters more once cost drifts into RB37-RB60.
- Zach Charbonnet, SEA: Best standalone Seattle target when prices are even. He matches the productive RB37-RB48 / second-RB archetype and has three years of NFL production behind him.
- Jaylen Warren, PIT: Cleanest standalone case. RB27 cost sits in the strongest historical winner bucket, and he already produced 217.1 PPR points in 2025.
- Jadarian Price, SEA / Rico Dowdle, PIT: Leverage companions. Draft to buy into the room or when camp usage points to a real split, not because they are safer than the lead case.
Walk away if the lead back rises into the top 24 RBs without a matching role or projection upgrade. The edge lives in the discount.
Before Acting
- Refresh ADP, roster/depth-chart, and implied-points snapshots inside the live draft window.
- Track Seattle and Pittsburgh camp usage first. The model already likes the rooms; the question is touch mix.
- Re-score secondary rooms if injuries, depth charts, or ADP move materially.
Sources and freshness: Historical ADP is Fantasy Football Calculator 12-team PPR from 2010-2025. The 2026 ADP application uses a June 13, 2026 redraft PPR snapshot. NFL stats, rosters, and schedules use a June 4, 2026 nflverse build. The 2026 implied-points screen was partial at snapshot time, covering 154 of 544 team-games.